A research concept map is a graphical representation that visually demonstrates the connections between different concepts, variables, or ideas within a research study or project. It serves as a visual tool to organize, explore, and communicate the key components and connections of a research topic or area.
Concept maps are also commonly known as Mind Maps. Creating these maps is called concept mapping or mind mapping.
A research concept map provides a clear and concise overview of a research project’s main ideas, components, and connections. It helps researchers organize their thoughts, identify patterns or gaps in knowledge, and guide the development of research questions, hypotheses, and methodologies.
Research concept maps help organize complex information, facilitating comprehension and knowledge sharing among researchers. They can be created using various software tools or drawn manually, allowing for customization and adaptability to the specific needs of the research project.
Why concept map is important for scholars
Concept mapping is an invaluable tool that plays a crucial role in research. As scholars strive to understand complex phenomena and generate new knowledge, a concept map offers a visual and systematic approach to organizing ideas, identifying relationships, and communicating research findings. A concept map enhances comprehension, facilitates critical thinking, and fosters collaboration among researchers by visually representing the interconnections between concepts. The significance of concept mapping in research includes the following:
- Organization and clarity. They provide a structured framework for understanding a research project’s main ideas and components, allowing researchers to organize their thoughts and identify potential gaps or missing links.
- Visualization of complex information. Concept maps help to simplify complex research topics by breaking them down into manageable components and illustrating the connections between them. This visual representation aids in better comprehension and communication of the research.
- Identifying research questions and hypotheses. Concept maps can assist researchers in formulating research questions and hypotheses by visually mapping out the relationships between variables and concepts, highlighting potential cause-effect relationships or areas that require further investigation.
- Planning research methodology. Researchers can determine the most appropriate research methods, data collection techniques, and analytical approaches to address their research questions by mapping out the relationships between different variables or concepts.
- Generating new ideas. Concept mapping stimulates creative thinking and idea generation. Scholars can explore new perspectives, identify research gaps, and generate novel ideas by visually mapping out concepts and their connections. Concept maps serve as a platform for brainstorming and organizing thoughts, which can lead to innovative research directions and breakthroughs.
- Collaboration and knowledge sharing. Concept maps facilitate collaboration among researchers by providing a shared visual representation of the research topic. They can be used to convey ideas, stimulate discussions, and ensure a common understanding among team members.
- Enhancing critical thinking. Concept mapping encourages scholars to think critically and analytically about their research. It requires them to evaluate and prioritize concepts, consider the strength of relationships, and identify areas that require further investigation. Scholars can refine their research questions, hypotheses, and methodologies by engaging in this process.
Stages of concept mapping in research
Concept mapping in research typically involves several stages that help researchers organize their ideas, establish connections between concepts, and develop a comprehensive understanding of the research domain. While the specific stages may vary depending on the context and goals of the research, the following outline provides a general framework for the process:
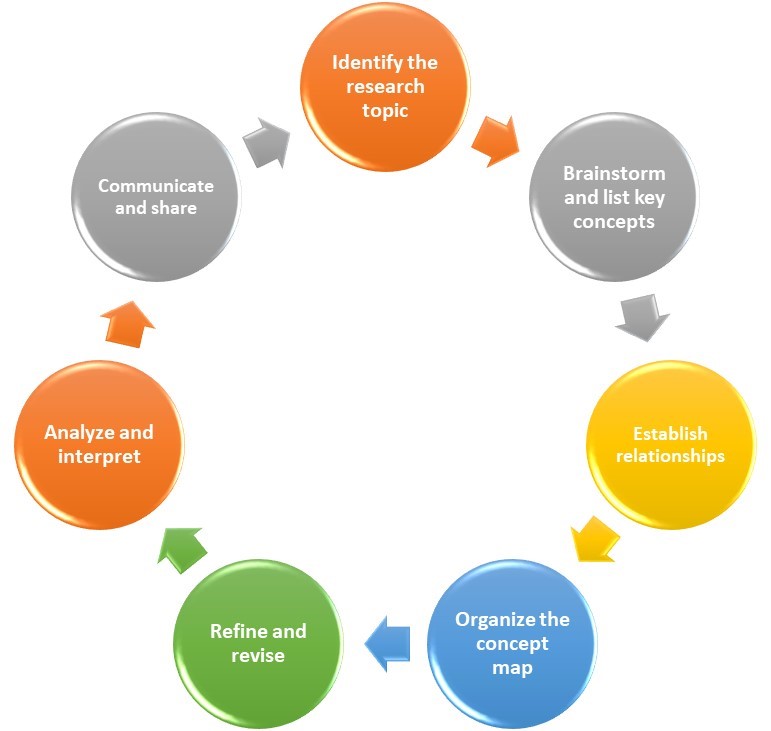
- Identify the research topic. The first stage involves clearly defining the research topic or question that will be explored. This sets the foundation for the concept mapping process, as it provides a clear focus for organizing concepts and their relationships.
- Brainstorm and list key concepts. In this stage, researchers generate a list of key concepts related to the research topic. These concepts can be theories, variables, ideas, or any other relevant components. The goal is to identify the main elements that need to be represented in the concept map.
- Establish relationships. Once the key concepts have been identified, researchers determine the relationships between them. This involves analyzing how the concepts are connected through causality, association, hierarchy, or any other relevant relationship. Researchers can use arrows or lines to represent these connections in the concept map.
- Organize the concept map. Researchers arrange the concepts and their connections logically and structure at this stage. The layout of the concept map should reflect the relationships between concepts, with related concepts positioned near each other. It is important to ensure clarity and coherence in the organization of the map.
- Refine and revise. Concept maps are not static; they evolve as research progresses. Researchers should review and revise their concept maps as new insights emerge or as they delve deeper into the research topic. Concepts can be added, removed, or modified, and relationships can be adjusted based on the evolving understanding of the research domain.
- Analyze and interpret. The concept map serves as a visual representation that aids in analyzing and interpreting research findings. Researchers can use the concept map to identify patterns, gaps, or inconsistencies within the research domain. It helps in gaining a comprehensive understanding of the interconnections between concepts and their implications for the research.
- Communicate and share. Concept maps are valuable communication tools for researchers to share their findings with peers, collaborators, or stakeholders. Researchers can present their concept maps to convey their research’s main ideas, relationships, and implications. This facilitates knowledge sharing, promotes discussions, and fosters collaboration.
How to make a concept map?
Now that you understand the importance of a concept map in organizing thoughts and generating new ideas. You can get started. It is a great way to enhance your research quality.
The best way to create concept maps is using pen and paper. Even teachers can use concept maps to discuss and develop ideas and brainstorm using a whiteboard.
One can also use commonly available notetaking programs that are quite good for creating concept maps, like Microsoft’s OneNote. The good thing about creating concept maps on OneNote is that it is easily shareable, and multiple authors can work on the concept map together.
One can also use other programs specifically created to make concept maps. Many online programs allow collaboration among teams. Thus, for example, one can use a free online program like Miro to create concept maps or mind maps. Alternatively, one can use another program called Lucidspark.
Concept mapping is important for scholars as it helps organize knowledge, identify relationships, stimulate creativity, enhance critical thinking, facilitate communication and collaboration, and support knowledge transfer. It is a valuable tool for scholars to better understand, explore, and communicate their research domain.
